

Free Business Guides
Why Am I Getting Leads but Not Sales?
Leads may not be turning into sales because the wrong people are contacting you, good leads are not reached quickly, qualification is weak, quotes are slow or unclear, follow-up stops too early, or the work is not easy to approve.
One conversion rate cannot explain the problem
The real path does not end when a customer says yes.
A healthy lead should become good-fit, profitable work that you can deliver well and collect on time.
Before buying more leads, lowering your prices, or blaming the marketing channel, find the first meaningful stage where strong opportunities are being lost.
A prospect may:
- 1. call, message, or submit a form;
- 2. receive a response;
- 3. enter a real conversation;
- 4. qualify for the work;
- 5. receive a quote or clear next step;
- 6. approve and complete the booking requirements;
- 7. receive the work;
- 8. receive an invoice and pay within the expected terms;
- 9. leave the business with acceptable margin.
Each stage answers a different question.
For this guide:
- Response means your business acknowledged the inquiry and attempted useful contact.
- Reached means a real two-way conversation occurred.
An automated confirmation may reassure the prospect that the inquiry arrived, but it does not count as a completed sales conversation.
A low inquiry-to-sale rate is not automatically bad if qualification is correctly filtering poor-fit leads.
A high close rate is not automatically good if you win nearly every underpriced quote or accept work you should not want.
The useful question is not simply:
What is our close rate?
It is:
Where do good-fit opportunities stop moving forward?
Use three benchmarks
There is no single healthy response time, qualification rate, quote rate, or close rate for every small business.
An emergency service, remodeling contractor, professional adviser, and product business have different buying cycles and customer expectations.
Use three practical comparisons.
1. Your promised service standard
Set the standard you intend to deliver.
Examples:
- inquiries acknowledged within 15 minutes during open hours;
- first human contact attempt within one business hour;
- qualified prospects receive a promised next step within one business day;
- standard quotes sent within two business days;
- complex quotes receive a confirmed delivery date.
These are examples, not universal rules. Use standards your team can meet accurately and consistently.
2. Your recent historical baseline
Review the last 20 to 50 leads and calculate the normal result at each stage.
Then compare the current period with that baseline.
A meaningful decline from your own recent performance deserves attention even when no reliable outside benchmark exists.
3. Clear warning signals
Treat a stage as a likely problem when:
- no one owns it;
- promised response or quote times are repeatedly missed;
- leads sit without a documented next step;
- good-fit prospects repeatedly stop at the same stage;
- the reason for loss is unknown most of the time;
- the business cannot reconstruct what happened;
- sales rise while margin, delivery quality, or collections weaken.
You do not need a perfect industry average to recognize a repeated operating failure.
A worked lead-path example
Suppose you receive 40 inquiries in one month.
- 32 receive a response.
- 24 are actually reached.
- 14 fit your service, area, timing, and likely value.
- 11 receive a quote or defined next step.
- 5 approve the work.
- 4 complete the booking requirements.
- 4 jobs are completed.
- 3 completed jobs meet the expected margin and delivery standard.
- 3 completed invoices are paid within expected terms.
The headline inquiry-to-approval rate is:
5 approvals / 40 inquiries = 12.5%
The full-path healthy-outcome rate is:
3 profitable, on-time paid jobs / 40 inquiries = 7.5%
That number shows why the approval rate alone does not describe the result the business actually needs.
Stage calculations
Response rate:
32 responses / 40 inquiries = 80%
Reach rate:
24 reached prospects / 32 responses = 75%
Qualification rate:
14 qualified leads / 24 reached prospects = 58.3%
Next-step rate:
11 qualified leads receiving a next step / 14 qualified leads = 78.6%
Quote acceptance rate:
5 approvals / 11 quotes delivered = 45.5%
Booking-completion rate:
4 completed bookings / 5 approvals = 80%
Healthy-delivery rate:
3 completed jobs meeting the expected margin and delivery standard / 4 completed jobs = 75%
On-time collection rate:
3 invoices paid within expected terms / 4 completed invoices due = 75%
The results also show the number lost at each stage:
- 8 inquiries did not receive a useful response.
- 8 responded-to inquiries never became a two-way conversation.
- 10 reached prospects were not qualified fits.
- 3 qualified prospects did not receive a quote or defined next step.
- 6 quoted prospects did not approve.
- 1 approval did not complete the booking requirements.
- 1 completed job failed the expected margin or delivery standard.
- 1 completed invoice was not paid within the expected terms.
Promised-standard comparison
Suppose your standards were:
- every inquiry acknowledged during open hours;
- first human contact attempt within one hour;
- every qualified lead receives a next step within one business day;
- every lost quote receives a documented reason when reasonably available.
The 80% response rate and 78.6% next-step rate show that the business missed two standards before anyone debates whether a 12.5% approval rate is acceptable.
Historical-baseline comparison
Suppose the previous 40 leads produced:
- 95% response;
- 85% reach;
- 60% qualification;
- 90% next-step rate;
- 44% quote acceptance.
Quote acceptance is nearly unchanged. Response, reach, and next-step performance have weakened. That points away from price as the first fix.
Warning-signal comparison
The review also finds:
- no backup response owner;
- several qualified leads without a promised next-step date;
- most lost quotes recorded only as "did not buy."
Those are operating failures even without an industry benchmark. The earliest repeated leak is response and contact handling. Buying more leads would feed that leak.

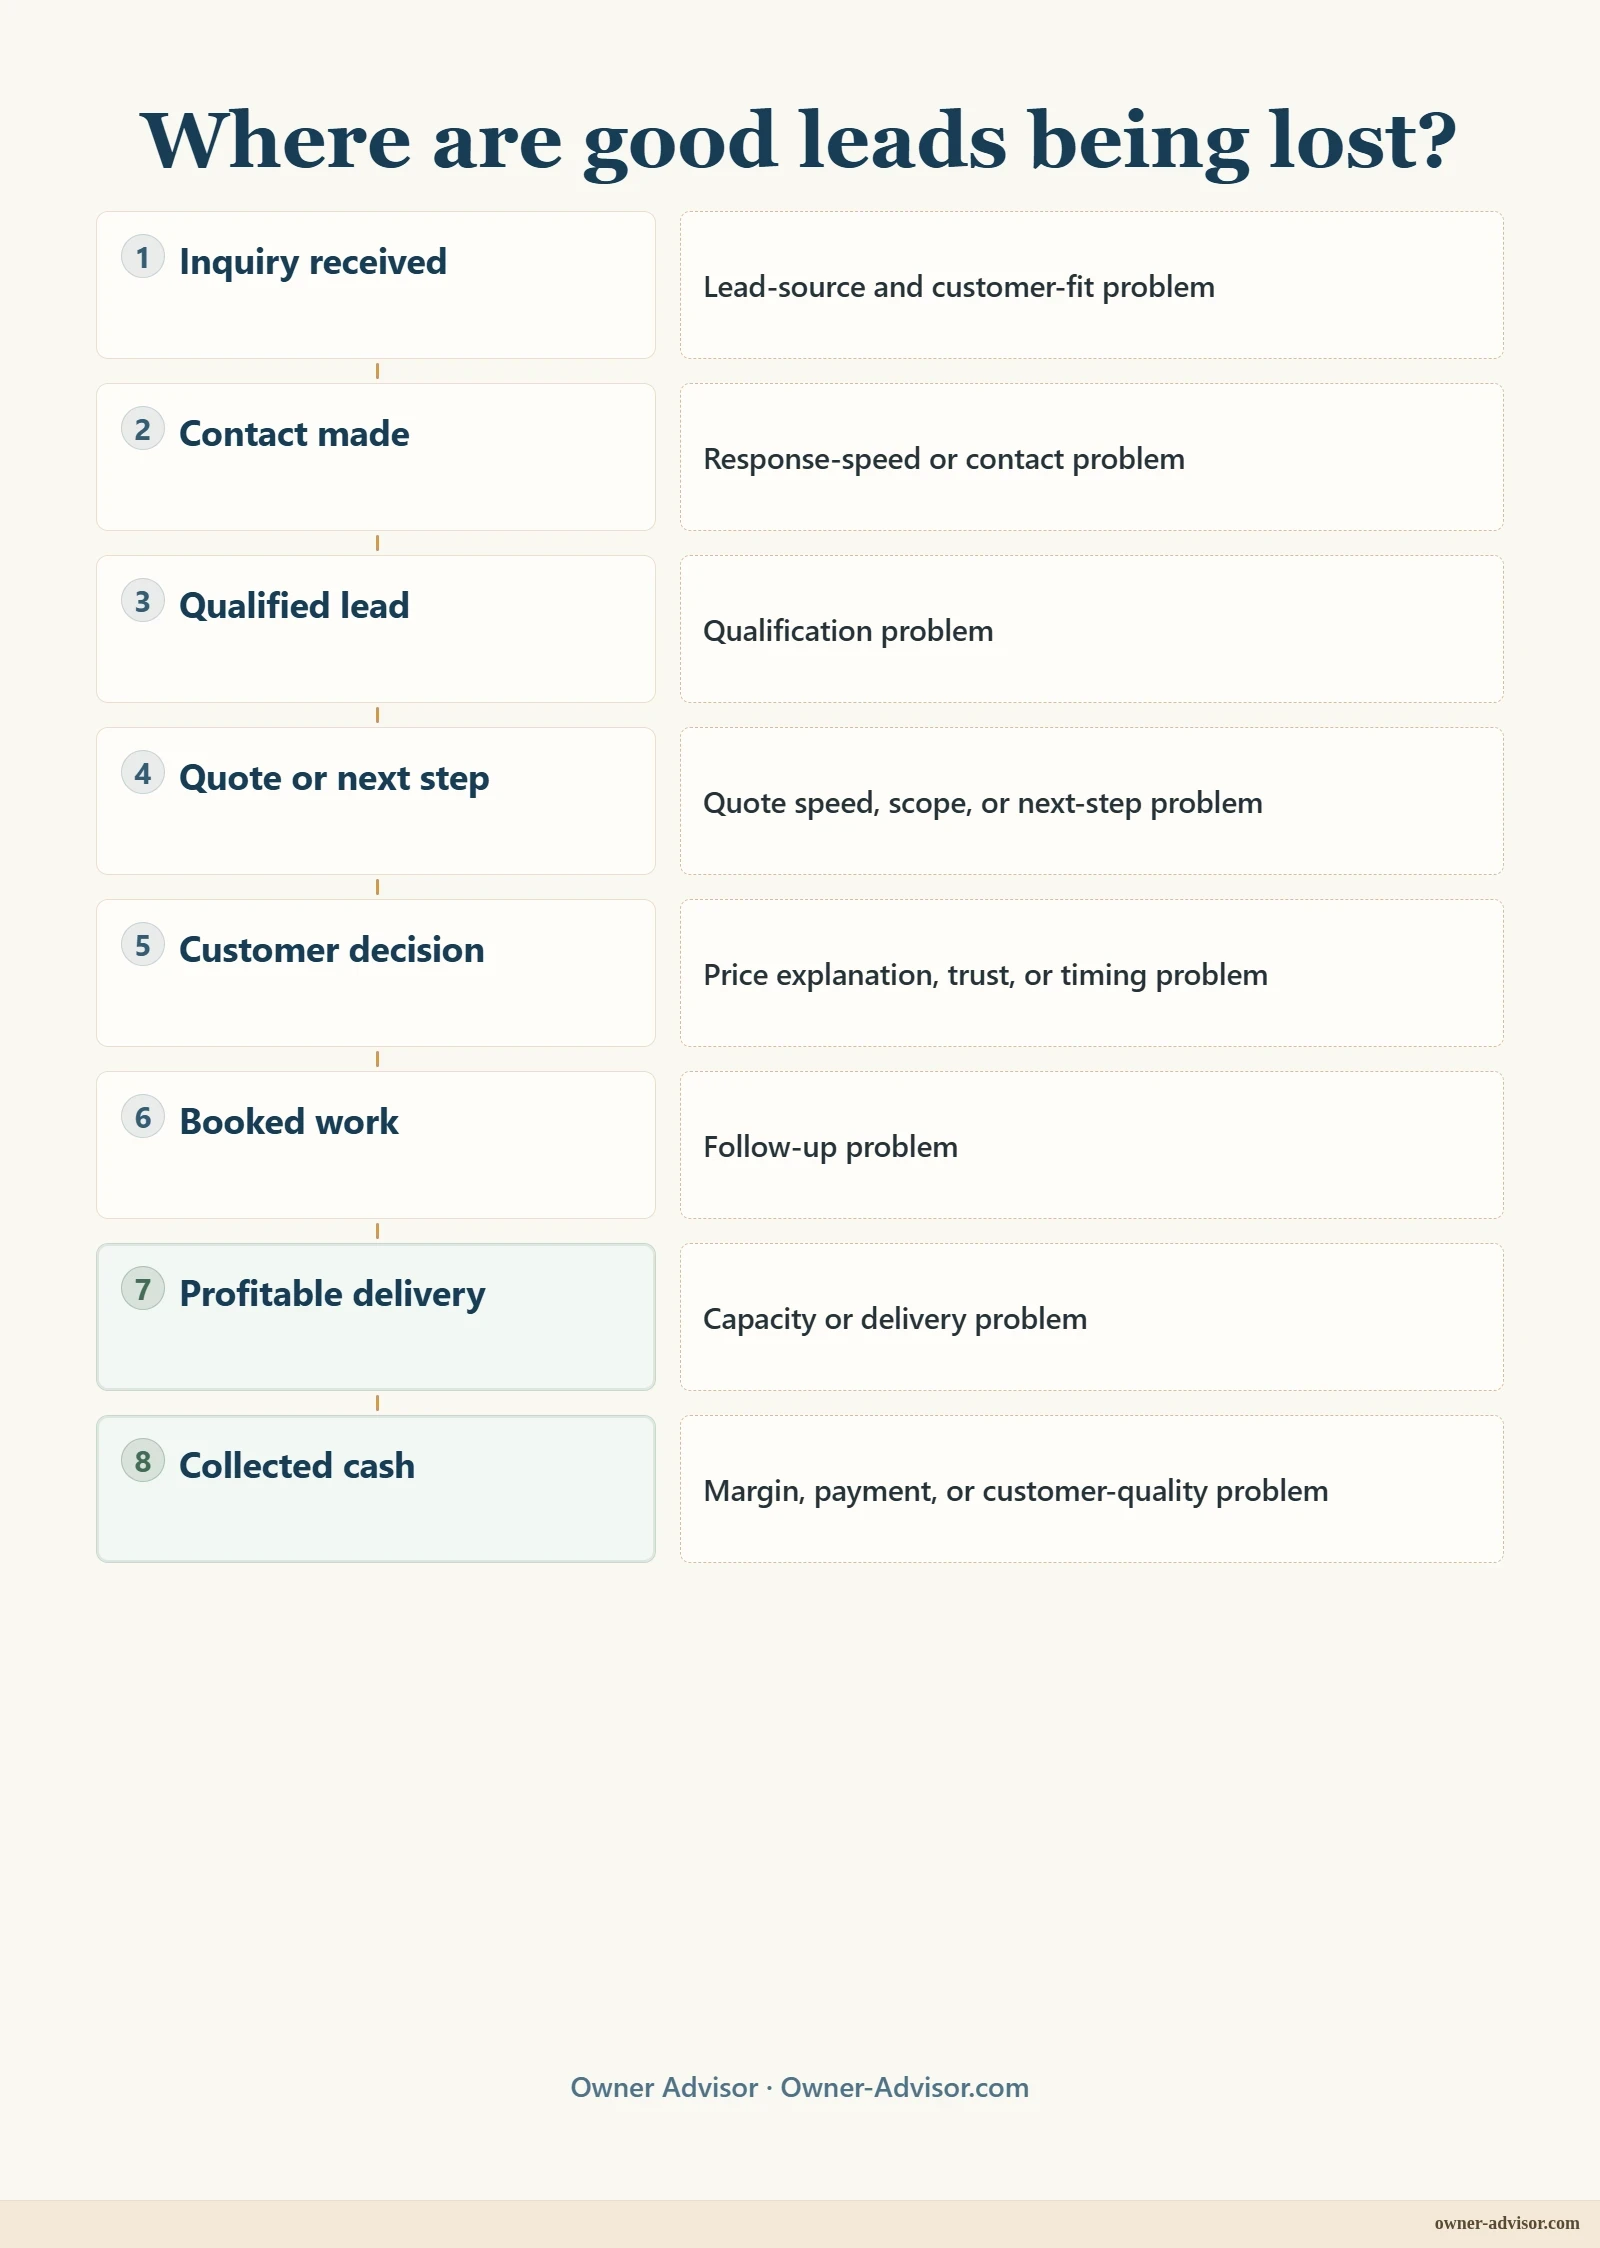
Review the path stage by stage
This guide helps you identify the failing stage and choose the first corrective move. It does not require rebuilding the entire sales system at once.
1. Inquiry to response and contact
Primary measures:
Response rate = inquiries receiving a useful response / total inquiries
Reach rate = prospects reached / inquiries receiving a response
Look for:
- missed calls or forms;
- slow first human contact;
- no response owner;
- one attempt with no follow-up;
- a decline from the recent reach baseline.
Start here: Assign one primary response owner, one backup, and a measurable first-contact standard.
2. Contact to qualified lead
Primary measure:
Qualification rate = qualified leads / reached prospects
Look for:
- inconsistent qualification questions;
- repeated leads outside the service area or offer;
- estimating time spent on clearly unsuitable work;
- qualification results that cannot be explained.
A lower rate may be healthy when qualification protects the business. The important question is why leads fail the fit test. Start here: Use the same small set of business-fit questions for the next 20 reached prospects. Keep qualification tied to service requirements and business fit, not protected personal traits or discriminatory screening.
3. Qualified lead to quote or next step
Primary measure:
Next-step rate = qualified leads receiving the promised next step / total qualified leads
Also track the median time from qualification to that step.
Look for:
- prospects waiting without an update;
- no promised delivery date;
- estimates delayed because only the owner can complete them;
- qualified leads disappearing before receiving an offer.
Start here: Give every qualified lead a specific next step, owner, and promised date. A prospect who never received a complete quote did not reject your offer.
4. Quote to decision
Primary measure:
Quote acceptance rate = approved quotes / quotes delivered
Also track the median time from quote to decision and compare it with the expected buying cycle.
Look for:
- quotes sent without review or explanation;
- lost reasons recorded as unknown;
- follow-up ending before the normal buying cycle;
- repeated confusion over scope, options, or next steps.
Start here: Review the quote with the prospect and agree on the next decision point before ending the conversation. Price may be the issue, but so may trust, scope, timing, proof, options, or another decision-maker.
5. Decision to booked work
Primary measure:
Booking-completion rate = approvals completing all booking requirements / total approvals
Look for:
- verbal approvals without signatures;
- deposits not received;
- documents or option selections missing;
- no one responsible for completing the booking.
Start here: Define the one action that makes the work officially booked and assign ownership of incomplete approvals. Verbal interest is not booked work.
6. Booked work to profitable delivery
Primary measure:
Healthy-delivery rate = completed jobs meeting the expected margin and delivery standard / completed jobs
Look for:
- scope changes;
- labor or owner time overruns;
- rework;
- schedule disruption;
- work that blocks stronger opportunities.
Start here: Compare expected and actual economics for the completed jobs that failed the healthy-delivery test. A sales process that efficiently wins unprofitable or unmanageable work is not working.
7. Delivery to collected cash
Primary measure:
On-time collection rate = invoices paid within expected terms / completed invoices due
Also track days from completion to invoice and invoice to payment.
Look for:
- delayed billing;
- unresolved disputes;
- weak deposits;
- completed work that remains overdue;
- sales growth without collected cash growth.
Start here: Assign one owner for immediate billing and receivables follow-up. Booked revenue and expected margin cannot pay current obligations until cash arrives.
Use specific lost-reason categories
Avoid one large category called "did not buy."
Use practical reasons such as:
- not contacted or contacted too late;
- could not reach;
- outside service or customer fit;
- timing not ready;
- scope information missing;
- quote delayed;
- price or value mismatch;
- scope or option mismatch;
- trust or proof concern;
- chose another provider;
- capacity or schedule mismatch;
- no response after useful follow-up;
- unknown.
Keep an unknown category.
Do not pretend to know what the customer never explained. Reduce unknowns through respectful follow-up and short lost-quote questions where appropriate.
Fix the first high-value leak
Do not repair every stage at once.
Prioritize the earliest stage where:
- the failure repeats;
- good-fit opportunities are affected;
- the result is worse than your standard or baseline;
- a clear warning signal is present;
- correcting the stage would improve later outcomes.
Examples:
- Poor-fit demand: review source, message, offer, and targeting.
- Uncontacted leads: fix response ownership.
- Delayed quotes: fix intake and estimating flow.
- Clear quotes going silent: inspect explanation, timing, proof, and follow-up.
- Won work producing weak results: repair price, scope, customer mix, or delivery.
One upstream correction can improve several later measures.
Run a 20-lead review
Review the last 20 inquiries using actual dates and outcomes.
For each lead, record:
- source;
- date and time received;
- acknowledgement time;
- first human contact attempt;
- date actually reached;
- qualification result;
- reason not qualified;
- promised next step;
- quote or next-step date;
- follow-up completed;
- lost reason or approval;
- booking completion;
- expected contribution;
- delivery result;
- invoice date;
- payment status;
- first stage where progress stopped.
Then:
- 1. Calculate the result at each stage.
- 2. Compare it with your promised service standard.
- 3. Compare it with your recent historical baseline.
- 4. Mark any clear warning signals.
- 5. Identify the earliest repeated high-value leak.
- 6. Choose the Start here action for that stage.
- 7. Apply it to the next 20 leads.
- 8. Compare the result.
Do not use the review to pressure employees into converting every inquiry.
Use it to make strong opportunities visible and protect the business from work it should not want.
The Marketing and Sales Performance Scorecard is available through Owner Advisor's Free Business Tools. The 20-lead review above remains usable on its own.
Lead handling can involve privacy, call recording, email and SMS consent, do-not-call rules, advertising claims, consumer-protection requirements, discrimination concerns, financing discussions, and industry-specific obligations. Confirm applicable requirements with the appropriate qualified professional.
Frequently asked questions
What is a good response time for a new lead?
Use the fastest standard your team can meet accurately and consistently.
Urgent services may require minutes. Other businesses may reasonably use one business hour or the same business day. Define acknowledgement and human contact separately, then measure both.
Does a low close rate mean my sales process is bad?
Not necessarily.
A low rate can reflect poor-fit traffic or disciplined qualification. Review conversion among reached, qualified leads before judging the sales process.
Should I lower prices when quotes do not close?
Not until you know price is the obstacle.
The problem may be scope, trust, timing, options, proof, follow-up, or customer fit.
How long should I follow up?
Match follow-up to the buying cycle and the prospect's stated timing.
Stop when the prospect declines, asks not to be contacted, the opportunity no longer fits, or continued contact would add pressure rather than clarity.
What if most lost reasons are unknown?
Treat that as a process problem.
Add one respectful lost-quote question, improve follow-up notes, and stop closing records without documenting what is actually known.
Get the Marketing and Sales Performance Scorecard
Track follow-up and conversion metrics across leads.
Related Business Guides
Read More Free Business Guides
Continue with the free Business Guides, Free Business Tools, and Business Owner FAQ for practical help available today.
Owner Advisor Business Guides are educational and practical. They do not replace legal, tax, accounting, HR, insurance, lending, or regulatory advice. Learn more about how we create and review our guides.
Browse Free Business Guides or read the Business Owner FAQ for what is available today.